What tympanometry measures
A tympanometer seals a soft probe in the ear canal, varies pressure and records how the eardrum and middle-ear system admit acoustic energy. The graph is a tympanogram. Common report fields include peak pressure, static admittance or compliance, tympanometric width and estimated ear-canal volume.
The test does not directly measure the softest sound you can hear. It is possible to have a broadly normal tympanogram and sensorineural hearing loss, because the main problem may be beyond the middle ear.
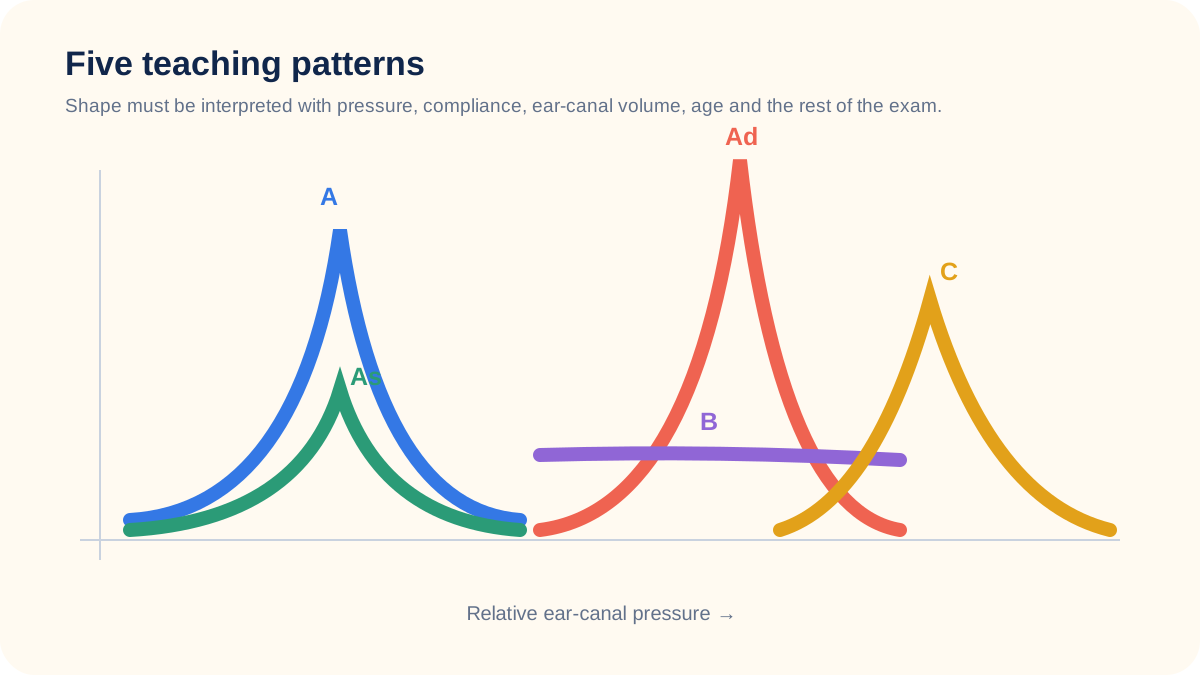
Type A: a peak near expected pressure
A Type A pattern has a recognizable peak in the expected pressure region and a compliance value within the equipment’s reference range. It usually supports normally functioning eardrum and middle-ear mechanics at the time of the test. It does not prove that overall hearing is normal and does not exclude an inner-ear or neural problem.
Type As and Type Ad
Type As (“shallow”) describes a centered but reduced peak. A stiffer system is one possible explanation, but the result needs otoscopy, thresholds and history. Type Ad (“deep”) describes unusually high measured mobility. More movement is not automatically better; a thin or healed eardrum and an ossicular-chain issue are among contexts a clinician may consider.
Reference ranges depend on the instrument, probe tone and patient age. A screenshot without its scale and values is not enough for a reliable interpretation.
Type B: why ear-canal volume changes the question
A Type B tracing is essentially flat. A flat curve with an ear-canal volume expected for that ear may occur when middle-ear fluid limits movement. A flat curve with a large volume can occur when the measurement includes space beyond the eardrum, such as with a patent tube or perforation. A very small volume may signal a blocked probe or poor placement. These are examples, not remote diagnoses.
Type C: negative middle-ear pressure
A Type C curve peaks on the negative-pressure side of the graph. It can be seen when pressure equalization through the Eustachian tube is not keeping up, including around an upper-respiratory illness or other middle-ear change. The degree of negative pressure, symptoms, duration and other findings matter. A Type C result does not automatically mean infection or permanent hearing loss.
Worked example and next step
Imagine a child with a flat right-ear curve. If the recorded volume is typical, the clinician may combine that finding with otoscopy and hearing thresholds when considering middle-ear fluid. If the volume is much larger than expected and a tube is present, the same flat shape has a different interpretation. The curve alone did not change; the surrounding evidence did.
Ask for the printed values, whether the seal was reliable, how the result compares with the other ear, and whether follow-up testing or medical evaluation is recommended. Seek prompt care for severe pain, drainage, sudden change or other urgent symptoms.
Build an evidence record
Interpret peak pressure, admittance, width and ear-canal volume with probe tone, age, seal quality and otoscopy. A type label compresses several measurements and reference ranges vary, so the plotted values are more useful than the letter alone.
Write the date, ear or listening condition, equipment or service involved and the decision the evidence is meant to support. Preserve the original report or agreement rather than a cropped screenshot. When two results disagree, record the mismatch and ask what additional check would resolve it. Reliable decisions make uncertainty visible instead of silently converting it into certainty.
Worked decision
Two flat tracings look alike. One has a typical canal volume and accompanies reduced air thresholds; the other has a large volume in an ear with a patent tube. The same shape supports different questions because the surrounding measurements differ.
This example shows why the same label can lead to different actions. The recommended next step follows the measured barrier, urgency and complete context. It does not assume that a more expensive device, a louder setting or a single test result is automatically more useful.
Prepare and verify the next step
Ask whether the seal was reliable, what volume was recorded, how the opposite ear compares and whether the finding is transient or persistent. Keep the numeric report for follow-up.
Choose a repeatable task and define success before the change. Record distance, noise, speaker, program, comfort, handling and any failure. Repeat the task after adjustment and keep a backup communication route while evidence is incomplete or equipment is unavailable.
At follow-up, compare the result with the original goal rather than asking only whether the person “likes it.” Confirm what improved, what remained difficult, whether setup was independent and whether the solution worked for other speakers or rooms. Document maintenance, repair and retesting responsibilities so a successful trial can become dependable daily access.
Share only the information needed for the decision. A clinician may need symptoms and test history, while an employer may need the functional barrier and proposed access method rather than a complete medical record. Clear boundaries protect privacy and keep the discussion focused on the task.
Important boundary
Tympanometry measures middle-ear acoustic behavior; it does not measure the softest sound a person can hear or diagnose infection by itself.
Seek prompt professional care for sudden hearing change, severe pain, drainage, acute dizziness, neurologic symptoms or a retained object. Product features, policies and official guidance can change; verify current instructions and primary sources when the decision affects health, safety, money or legal rights.
Sources and review notes
Sources were checked for this editorial update on September 26, 2026. External guidance can change; follow the linked source for the current version.
- American Academy of Audiology — Clinical Practice Guidelines
- ASHA Practice Portal — Hearing Loss in Adults
- Legacy Basic Hearing Evaluation module
This page provides education, not an individual diagnosis, treatment plan, legal opinion or billing decision. Historical expert contribution is credited only where supported by the original project record; it does not imply review of this update.